
Documentation
Learn Flux.
Start with a complete first project, understand how a project is organised, or go straight to a workspace, the Python plotting library or a reference page.
Install Flux
One command on macOS or Linux, then the companions you need.
5 minutesStep 2Your first project
A plot, a figure, a manuscript and a presentation, connected from the start.
20 minutes · Step by stepStep 3Projects and files
What lives in a project, how it updates, and what to keep when you share.
6 minutes · Core concepts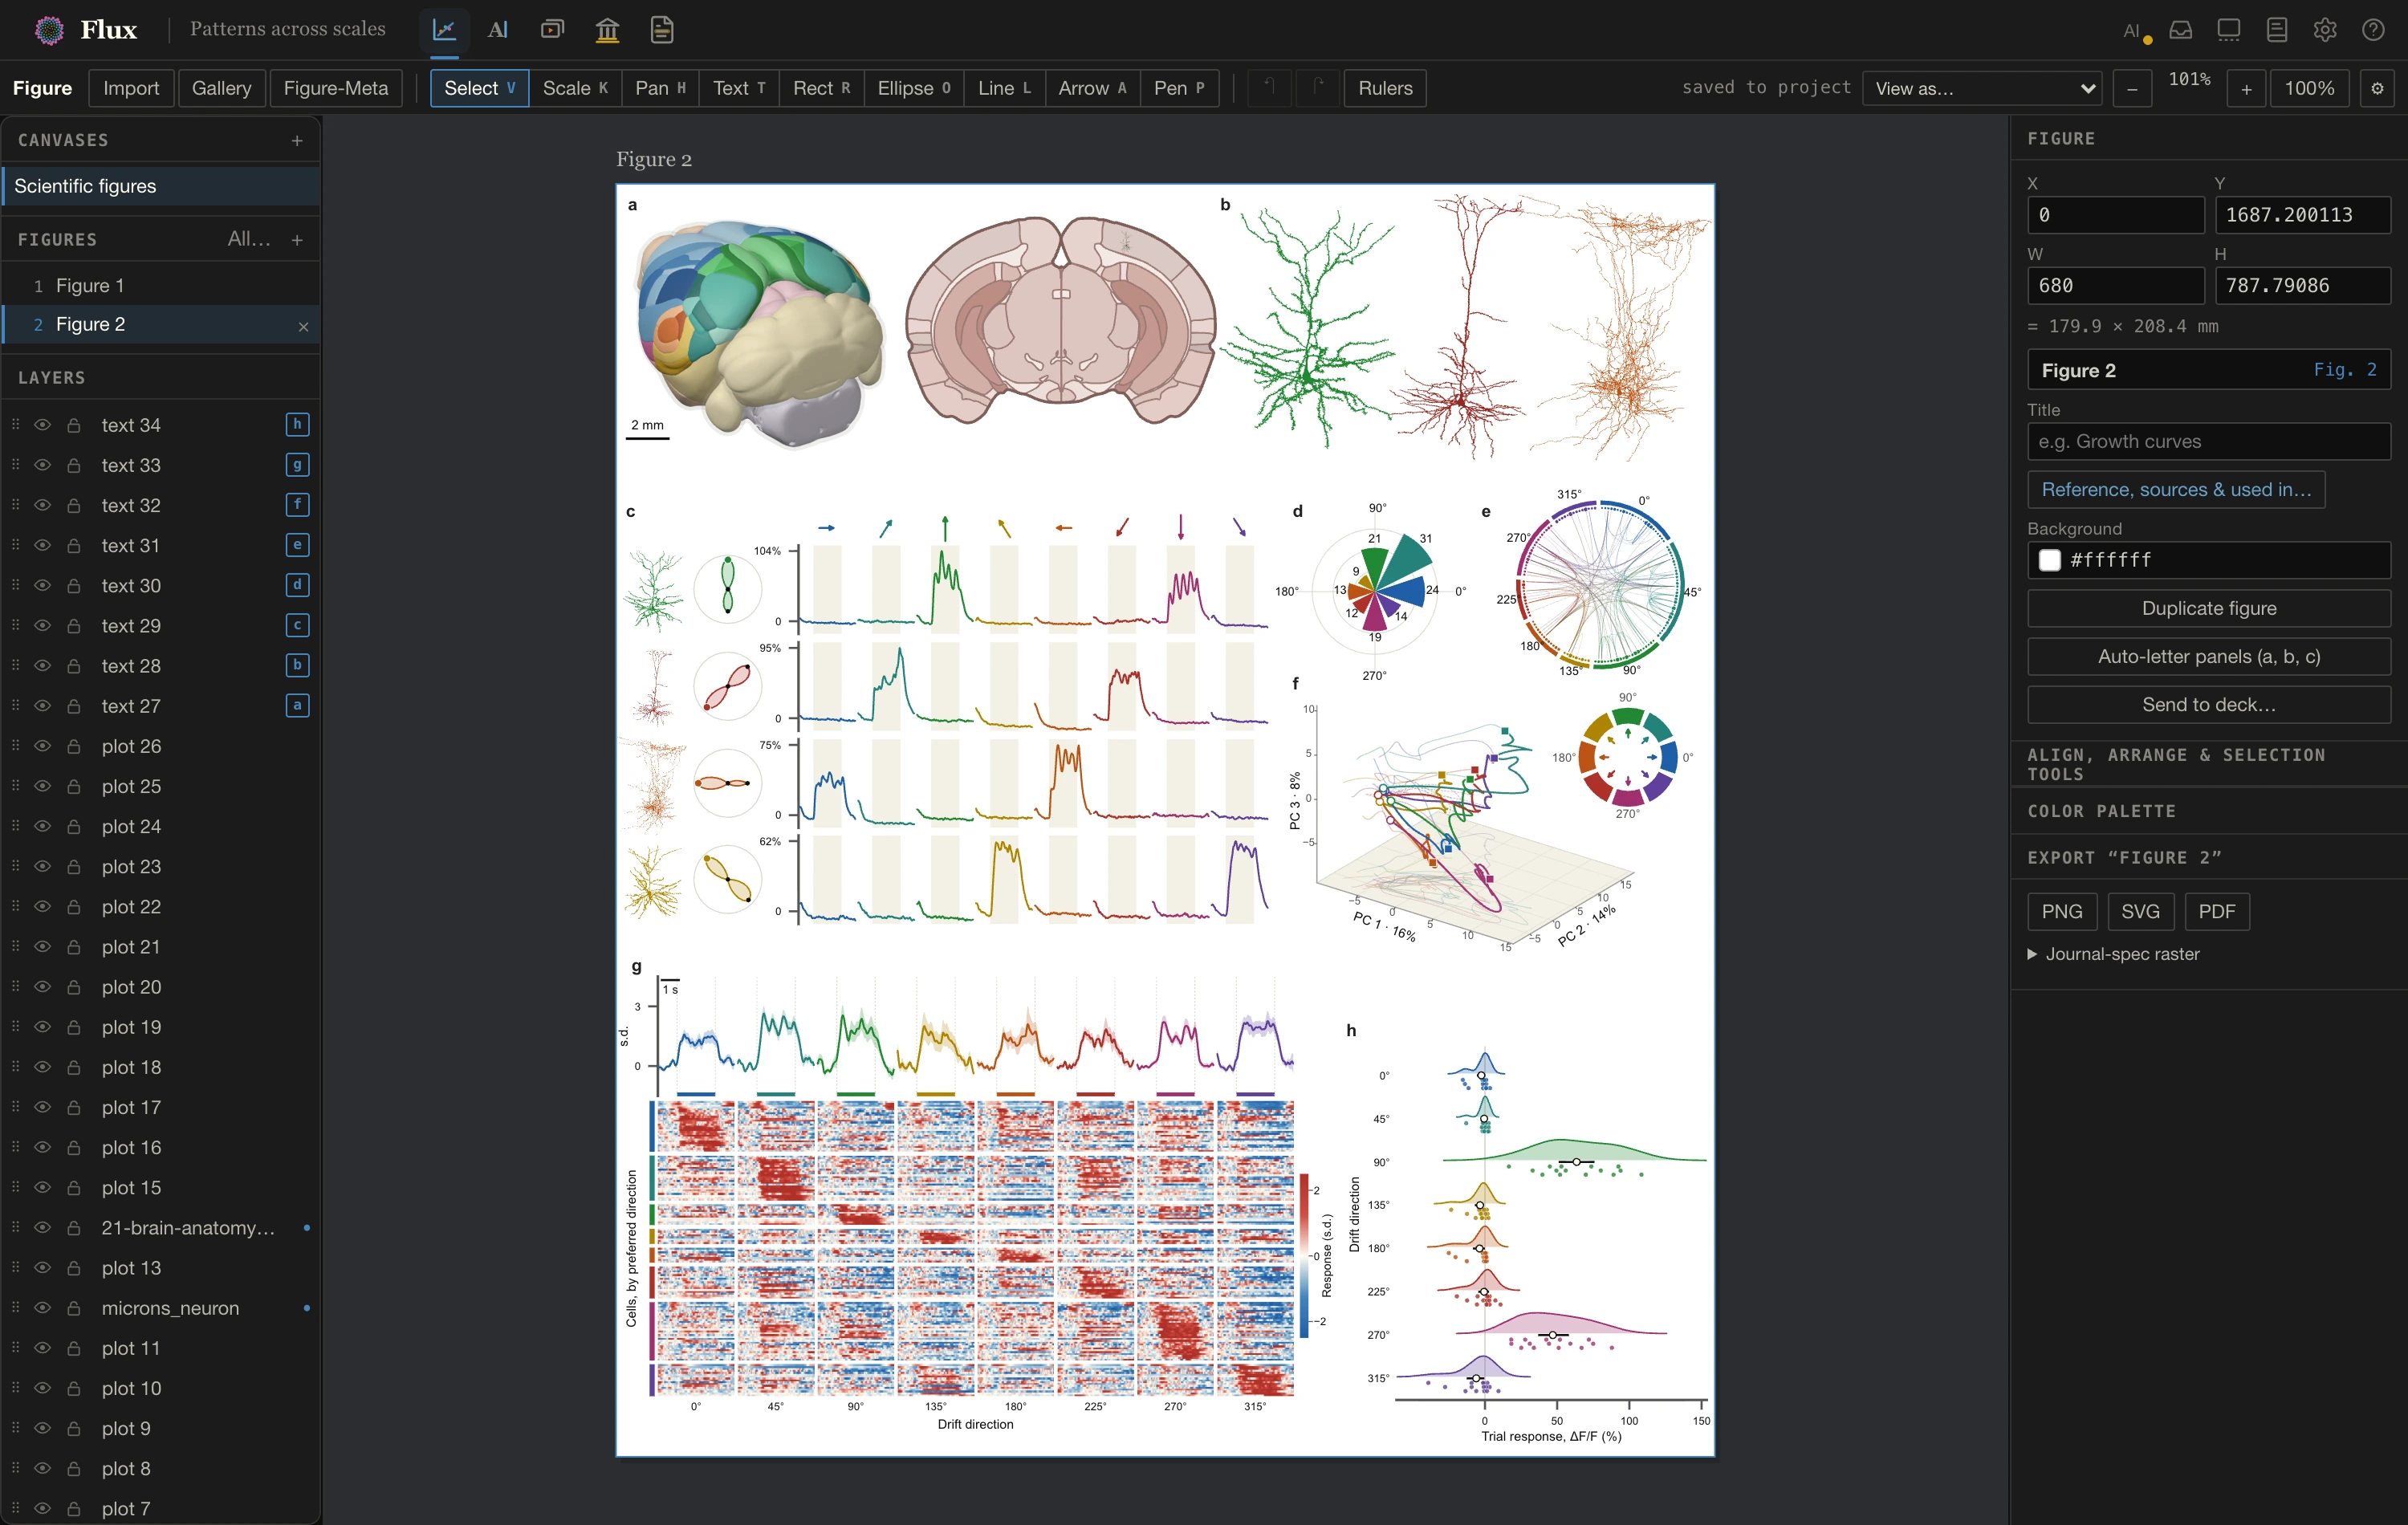
Start here
3 guidesWriting
4 guidesPaper
Write and organise documents, with figures and references close at hand.
Citations, figures and tables
Insert references and scientific content that stay connected as you edit.
Writing tools
Adjust the reading surface, manage technical vocabulary, and choose how corrections work.
Export documents
Choose a file format, apply a journal style, and check the result.
Figures
5 guidesFigure
Compose publication figures from plots, images, text and 3D models.
Plot gallery and source links
Find plots, insert them at their intended size, and keep their sources current.
Edit plot parts and data views
Select a series, change its appearance, and adjust axes or colour scales without rerunning the analysis.
Layout, drawing and typography
Arrange panels, draw annotations, and control the details of a figure.
3D models in Flux
Import a model, choose its view, and work with named parts, value fields and shape states.
Presentations
5 guidesSlides
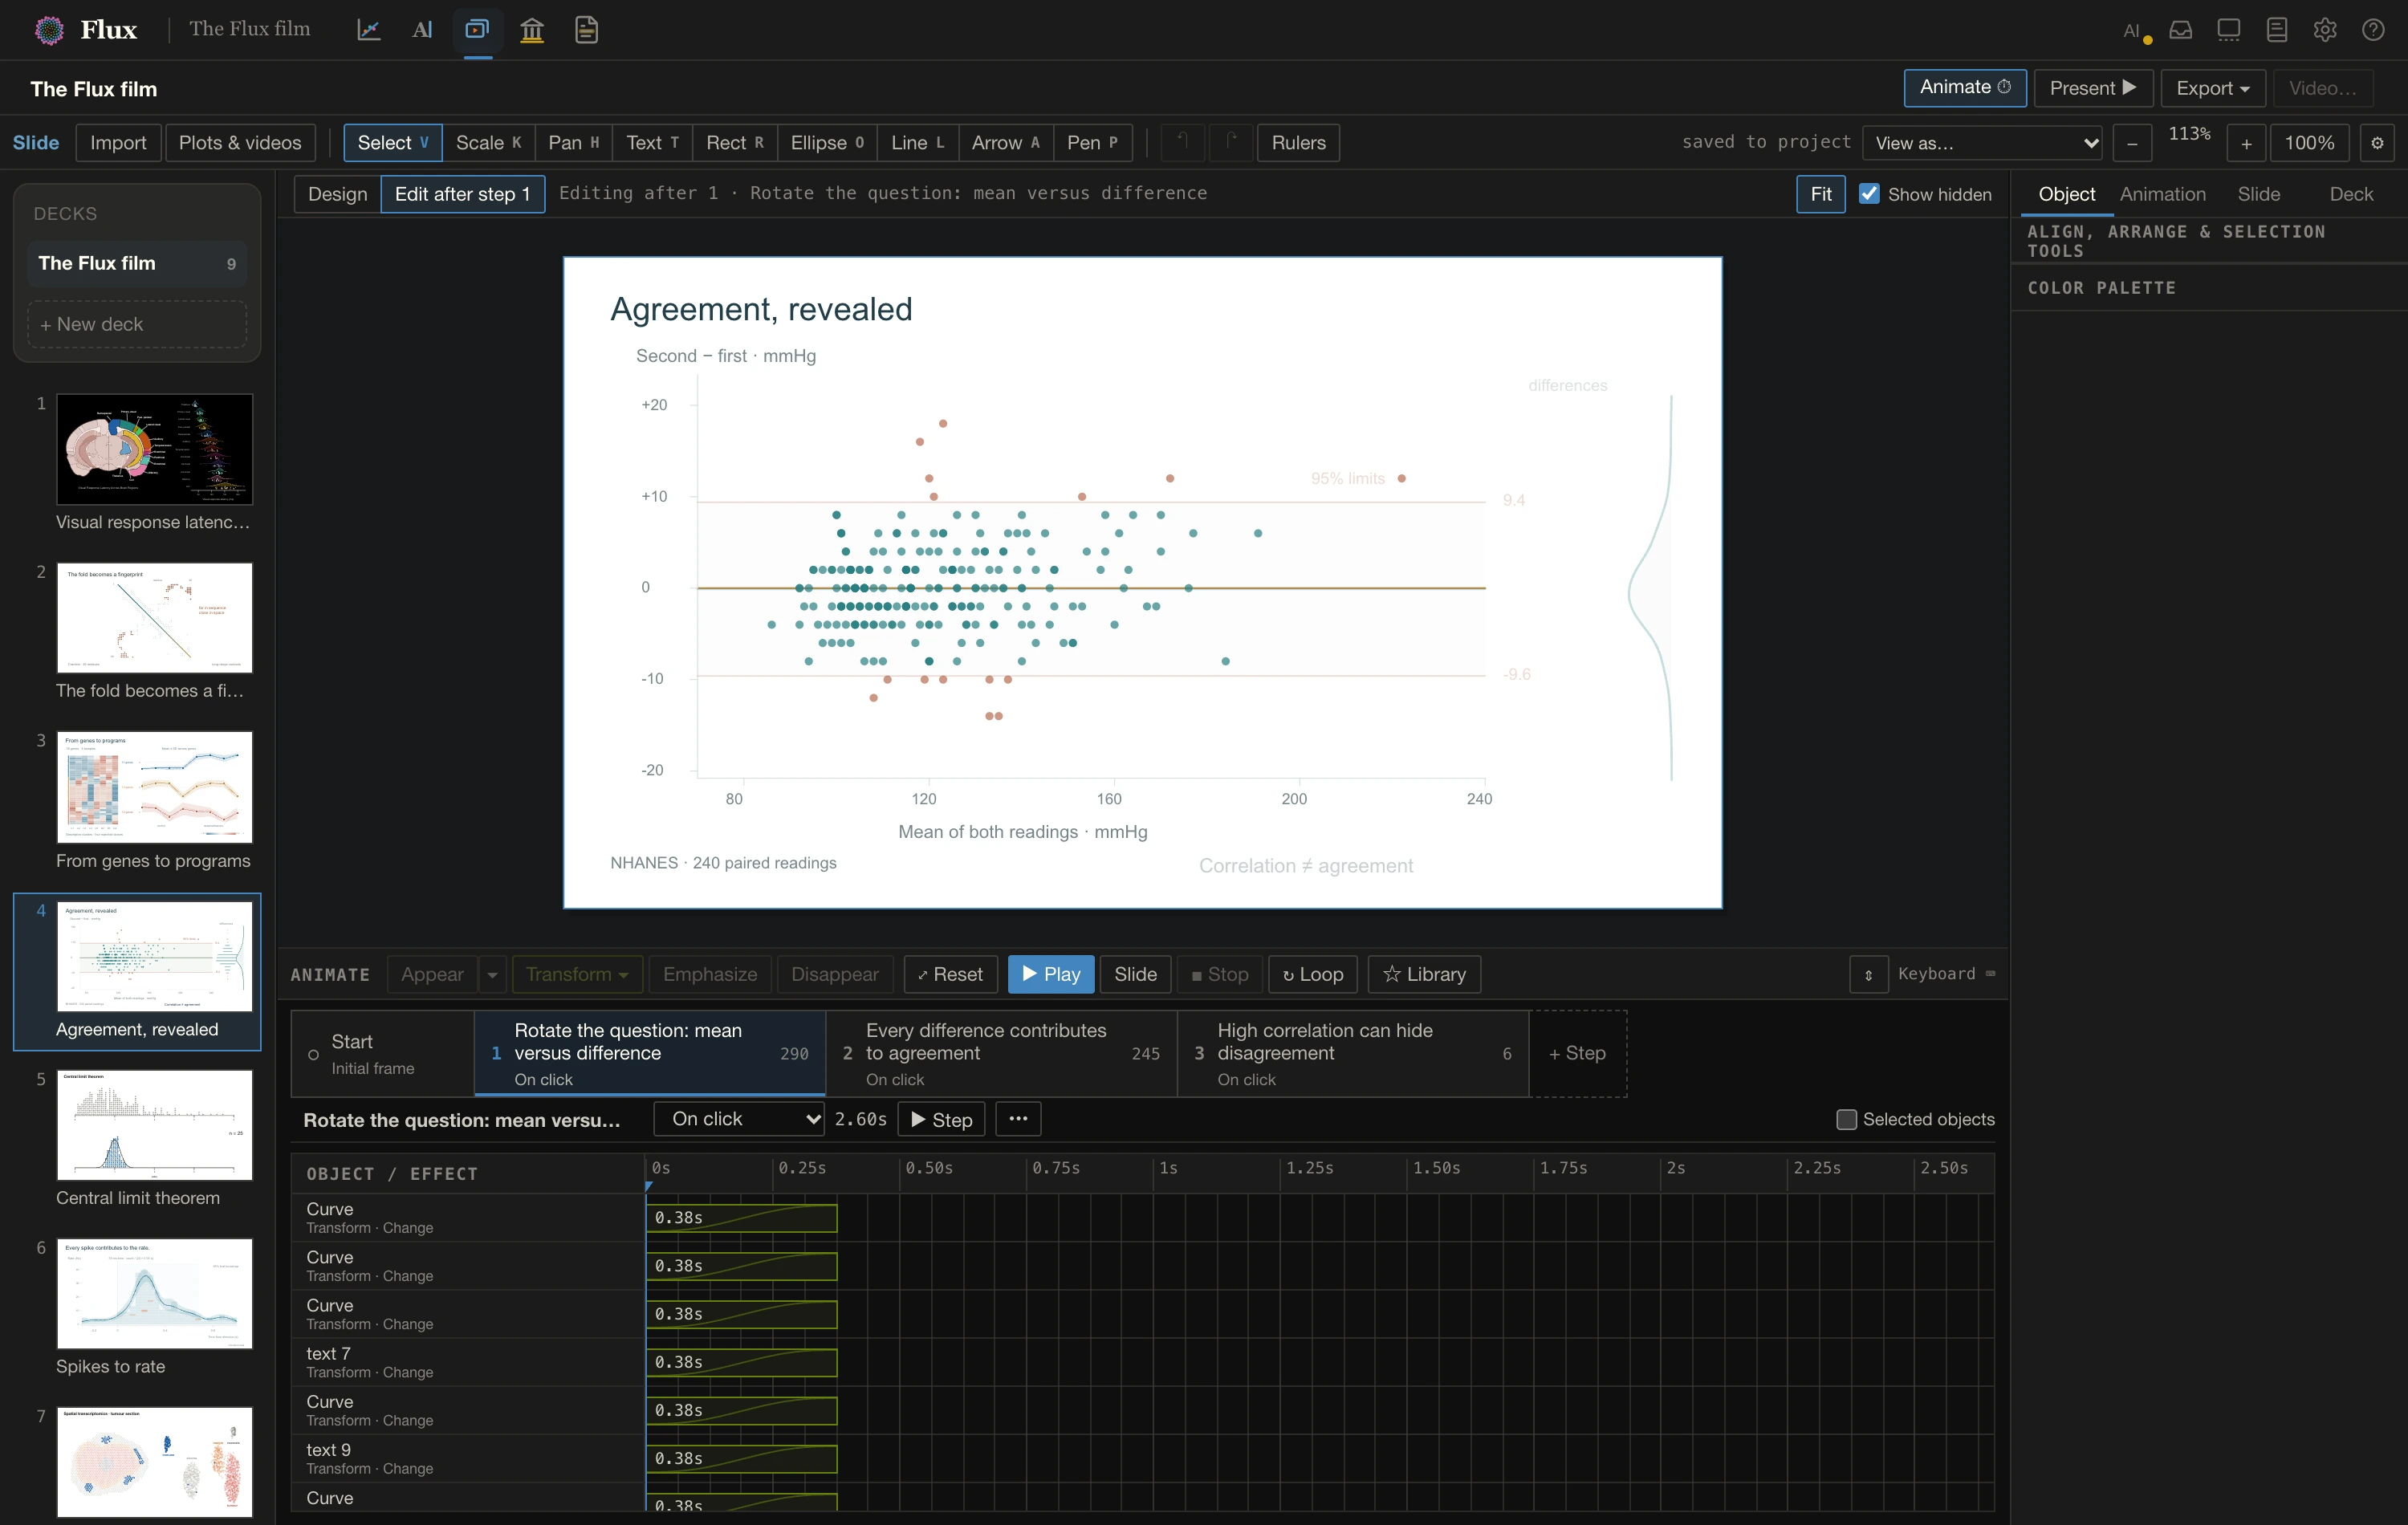
Build a presentation from the plots and figures in your project.
Animation and timing
Reveal the right information at the right moment. Control steps, effects, timing and reusable styles.
Transforms and data morphs
Move between views, change a plot’s data, or turn one object into another.
3D and video in slides
Present moving models and video clips with the same step controls as the rest of your talk.
Present and export
Rehearse a talk, share an interactive HTML deck, or export PDF, PowerPoint and video.
Reading
2 guidesPlotting
11 guidesfluxplot
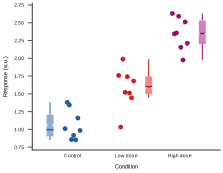
Create plots in Python that stay editable in Flux: a complete example, installation, and the path to more advanced plotting.
Semantic plots
A plot with named parts remains editable after it leaves Python.
Dissections
Keep the supporting panels and statistics one step away from the main plot.
Lines, points and distributions
Choose a plotting helper, name the series, and keep its parts editable.
Images and surface maps
Show calibrated images, channels and projected mesh data alongside ordinary plots.
Glowbar, fluxbox and hexmatrix
Show observations, summaries and density with individually named plot parts.
Statistics and comparison brackets
Compute reporting rows with effect sizes and intervals, then attach the same results to a plot.
Colour and style
Choose a theme, keep colours consistent, and define scales that travel with the plot.
Saving, panels and recipes
Save at a known physical size and record the information needed to regenerate the plot.
Matrices, contours and colour scales
Represent a field, define its value-to-colour mapping, and share a scale across panels.
3D plots
Build an orbitable scene with named mesh parts, value fields, shape states and a saved view.
Working with AI
3 guidesIntegrations
3 guidesReference
8 guidesCommand line
Inspect projects, make precise edits, and export work from a terminal.
Keyboard shortcuts
Find a command by workspace. On macOS, use Command for Ctrl and Option for Alt unless stated otherwise.
Project layout
A file-by-file reference for a Flux project.
Library and configuration
Know what belongs to a project and what is shared across your projects.
Plot format and identity
Understand the files, stable IDs and data contracts used by Flux and other consumers.
Python API reference
Signatures and behavior of the public fluxplot plotting, saving, 3D, colour and statistics functions.
Settings and setup
Adjust Flux's general settings, Figure controls, Paper margins, correction tools and external dependencies.
CLI and MCP command reference
The complete Flux command catalog, flags, root resolution, MCP tools and connection protocol.
Around Flux
3 guidesLighttable
Browse and compare sets of images in Flux’s separate visual companion.
Contributing and support
Report an issue, improve the documentation, or work on the Flux and fluxplot source repositories.
Visual and data credits
Sources, interpretation and attribution for the scientific figures, native slides and screenshots shown on the Flux website.