
Semantic plots
A plot with named parts remains editable after it leaves Python.
Most tools treat a saved plot as a picture. Flux treats it as a structure: when a plot is made with fluxplot, every meaningful part of it — a series’ line, its 4th data point, the x-axis title — carries a stable name. That one idea is what makes Flux figures feel alive:
- Click into a plot and restyle a part — one line’s colour, one label’s size — in the Figure workspace, without touching your analysis code.
- Regenerate without losing your tuning. Re-run the analysis script and the plot updates in place; your per-part restyles survive, because they’re keyed to the part names, not to pixels.
- Animate at the level of parts in the Slides workspace — fade one series in, draw a curve on, morph one chart into another.
Every part has a name
Hover the plot below. The box of one condition, the median line inside it, a single point, the tick labels of the x axis: each is its own element in the saved SVG, and each carries an id that Flux, your captions, your animations and your agent all use to refer to it.
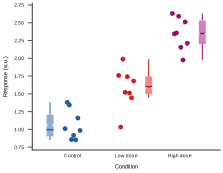
Move the pointer over the plot, or choose a part from the list. Every element you land on has a stable name. Click a part to keep it selected.
A real plot saved by fluxplot, inspected on this page. The names come from the plot’s own manifest, exactly as Flux reads them. Values are synthetic.
What fluxplot is
fluxplot is an ordinary Python library you use in your analysis environment — “matplotlib, but every meaningful thing has a name.” You plot through thin helpers that take a series name, then save with fp.save():
import matplotlib.pyplot as plt
import fluxplot as fp

fp.use_light()   # the house style: Flexoki palette, clean axes

# t, control and treatment come from your analysis of data/growth.csv.
fig, ax = plt.subplots(figsize=(6.4, 4.8))
fp.line(ax, t, control,   series="control",   marker="o", label="Control")
fp.line(ax, t, treatment, series="treatment", marker="s", label="Treatment")
ax.set_xlabel("Time (h)")
ax.set_ylabel("OD600")
fp.legend(ax)

fp.save(fig, "plots/growth.svg", recipe={"inputs": ["data/growth.csv"]})Saving into your project’s plots/ folder writes three files that travel together:
plots/growth.svg            ← the plot, with named, addressable parts
plots/growth.fluxplot.json  ← the manifest: data, coordinates, parts inventory
plots/growth.recipe.json ← the recipe: how it was made, so it can be re-madeName series consistently across related plots: the name is the handle Flux restyles by. When saving from a Python script, fluxplot discovers the script automatically, so the recipe above only adds the input file. Pass "params" as well when the script takes parameters (see Recipes and parameters), or recipe=False to suppress script discovery. Installation and a complete first script are in the fluxplot quickstart; every function is listed in the Python API reference.
True physical size
Plots import at their true printed size: a matplotlib figsize=(6.4, 4.8) panel lands on the canvas at exactly 6.4 × 4.8 inches, and what you lay out is what prints. Flux never silently rescales an import to fit — if a plot is bigger than its figure frame, it overflows visibly (with a toast pointing at Ctrl+Shift+I to bring it inside). Sizing decisions belong to you and your plotting code, not to an importer.
Regenerate, don’t re-save
To change a plot, re-run the script rather than hand-editing the output. With the app open, the regenerated plot hot-swaps into your figures live, restyles intact. And because the recipe records the script, its parameters, and its inputs, a plot can be regenerated with different parameters — from the app or the command line — without editing code.
What about plots from anywhere else?
Other SVGs also import with an automatically derived parts tree for editing and animation; PNGs remain images. Derived SVG parts do not carry the original scientific data or a recipe; fluxplot supplies that additional meaning. If a plot saved by fluxplot imports as a flat image, something is wrong, and flux validate-plot plots/<name>.svg says what.
Multiple panels and precise data
From schema 0.3, fluxplot keeps each subplot’s series and axes separate, including shared axes, twins and insets. Give panels stable names before plotting when their layout may change:
fig, axes = plt.subplots(1, 2, layout="constrained")
fp.panel(axes[0], "baseline")
fp.panel(axes[1], "followup")Both panels can now use series="control" without merging their identities. Ordinary single-panel plots retain their existing part names. Saving after editing captures the current artist data; small scientific values keep their precision, and missing observations remain gaps.
Slides use each series’ owning axes when interpolating data. A matching line/scatter plot with supported linear or logarithmic axes can morph in data space. Polar/3D projections, unsupported scales, field layers and other composite plots use the complete transition behavior. Existing projects stay readable; upgrading does not regenerate your plots automatically.
Matrices, contours and colour scales
Use fp.heatmap, fp.contour, fp.contourf and fp.colorbar to name the field and its key:
# matrix comes from your analysis.
fig, ax = plt.subplots()
image = fp.heatmap(ax, matrix, series="correlation", cmap="viridis", vmin=0, vmax=1)
fp.colorbar(image, name="correlation", label="Correlation")
fp.save(fig, "plots/correlation.svg")For a modest matrix, cells=True makes individual cells addressable. Large fields stay efficient as one named raster layer. Raw matrix values are only included when include_values=True. The matrices and colour scales guide covers fields in detail.
Recolour a plot without Python
A plot saved with fluxplot schema 0.3.1 or later records each colour scale’s exact law (the colormap table, the normalization and its limits) and the data value of every coloured element, so Flux can recolour the plot itself:
- Select the plot and edit Colour scales in the Object inspector, or colour scale in its F menu. The palette, its direction, the norm kind, the limits and
extendchange live, together with the colorbar. The edit is saved with the figure or slide, and tweens in a talk. - Apply to source writes the complete colour controls into the recipe (
__fluxplot__, keyed by the series name) and regenerates the plot from the source data, keeping your named-part overrides. It needs a runnable recipe and affects only that plot’s save, leaving sibling outputs untouched.
Plots saved with an older schema offer only the palette and range fields in the X-ray, and those regenerate the plot.
Series colours and deck themes
The manifest also records each series’ colour (its hex value and, when fluxplot drew it from a palette, the exact palette token) and the theme token of every scaffold element. With it, Flux can give a whole series one colour (Series colour in the Plot part section, or set-series-color from the command line), and a plot on a slide can follow the deck theme: its ink, axes and gridlines take the theme’s colours, while data colours never change.
Read the data back
flux get-plot-data returns what the plot shows: every series’ exact values and per-point IDs, hexmatrix bins, glowbar and fluxbox statistics, heatmap values, image channels, axis domains, and each significance bracket’s test and p-value. Long arrays are windowed. In Flux, hold Ctrl while hovering a part to see the same facts on the canvas.
What schema 0.3.2 adds
- A colour scale can carry an opacity channel (
alpha_by, for example a hexagon’s count or a cell’s p-value), which recolours live with the palette. - Twin value axes (
ax.twinx()and secondary axes) get their own axis view. - Bars, cells and hexagons carry stable keys and their data boxes, so an axis view moves them and a Become between two versions of a plot tweens them member by member.
- Every axis records its tick scheme, so a viewed axis is re-ticked.
- Fits (
fp.regression,fp.kde), steps, stems, images and the figure’s own title, legend and annotations are named parts thatget-plot-dataand the hover readout report.
Two kinds of ID changed in 0.3.2: spines are now named like axis.x.spine.bottom, and some series names are spelled differently so they no longer collide. The manifest’s idAliases maps the old IDs, so overrides, captions and effects saved against an older plot keep pointing at the same parts.
Checks on import
New imports and linked-source reloads verify the SVG/manifest checksum before accepting the bundle. If generation is still writing files or the sidecar belongs to another SVG, Flux keeps the last accepted plot and reports the mismatch. This check runs before any repair of older SVGs.